What’s an Activity Diagram?
An activity diagram is an important behavioural diagram in UML used to describe the dynamic aspects of a system. Activity diagrams are essentially an advanced version of a flowchart that models the flow from one activity to another.
When do we use Activity Diagrams?
Activity Diagrams describe how activities are coordinated to provide a service which can be at different levels of abstraction. Typically, an event needs to be achieved by some operations, particularly where the operation is intended to achieve a number of different things that require coordination, or how the events in a single use case relate to one another, in particular, use cases where activities may overlap and require coordination. It is also suitable for modelling how a collection of use cases coordinate to represent business workflows.
Activity Diagrams are useful to:
- Identify candidate use cases, through the examination of business workflows
- Identify pre- and post-conditions (the context) for use cases
- Model workflows between/within use cases
- Model complex workflows in operations on objects
- Model in detail complex activities in a high level activity Diagram
Differences between Activity diagrams and Flowcharts
Flowcharts were typically invented earlier than activity diagrams. Non programmers use Flow charts to model workflows. For example: A manufacturer uses a flow chart to explain and illustrate how a particular product is manufactured. We can call a flowchart a primitive version of an activity diagram. Business processes where decision making is involved is expressed using a flow chart.
Construction
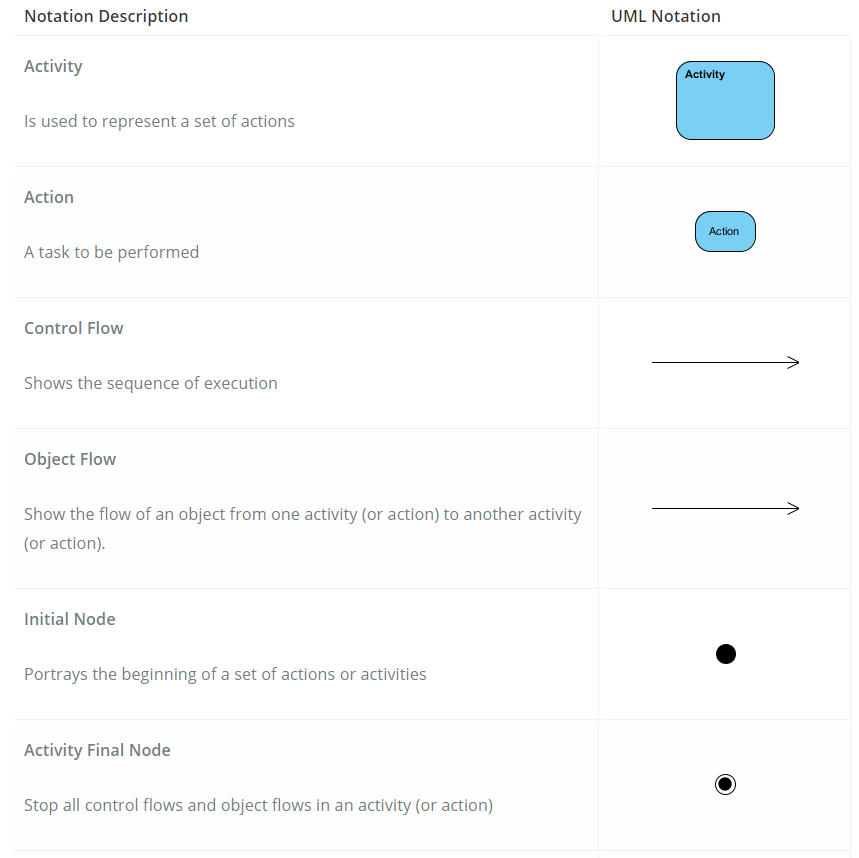
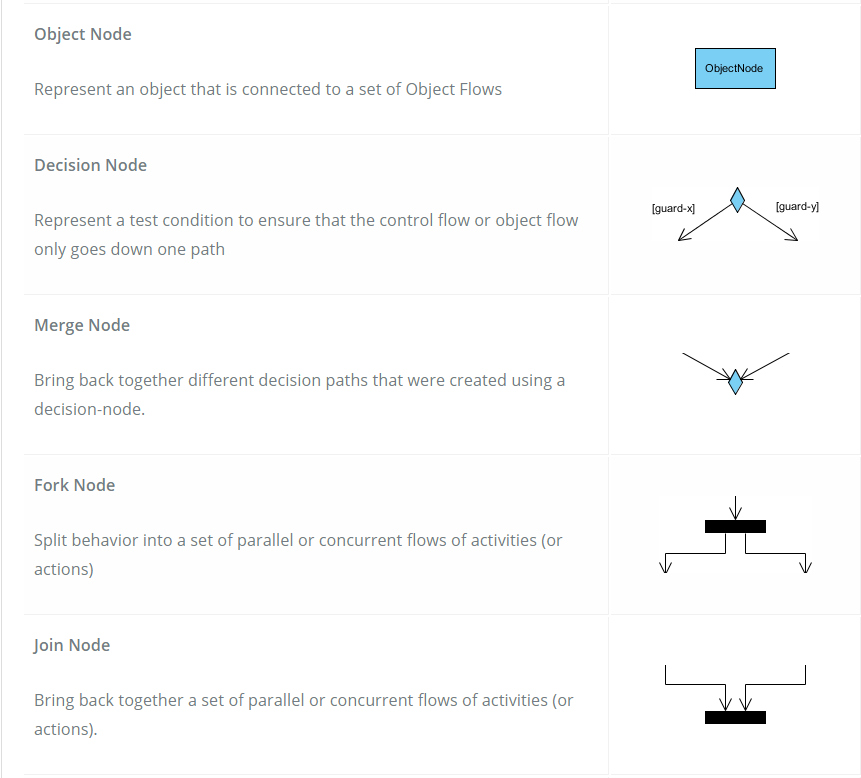
Activity diagrams are constructed from a limited number of shapes, connected with arrows.
The most important shape types are:
- Ellipses, representing actions
- Diamonds, representing decisions
- Bars, representing the start (split) or the end (join) of concurrent activities
- Black circles, representing the start (initial node) of the workflow
- Encircled black circles, representing the end (final node) of the workflow
- Arrows, running from the start towards the end, representing the order in which activities happen
Activity Diagrams Cheatsheet
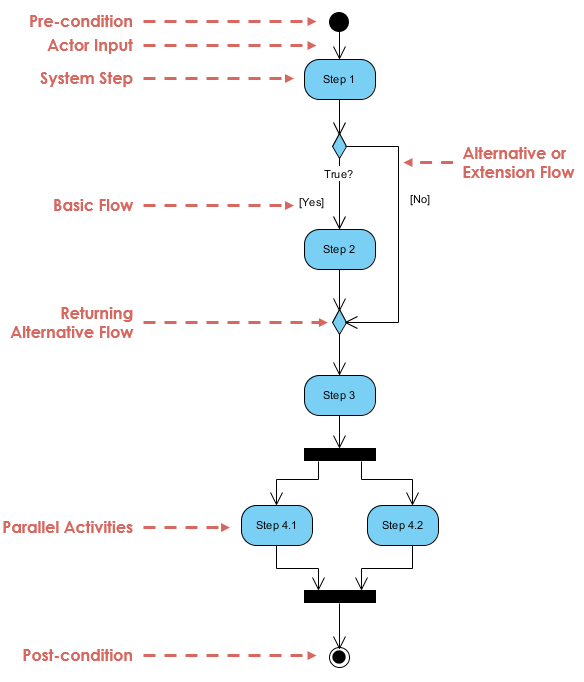
Structure of an Activity Diagram
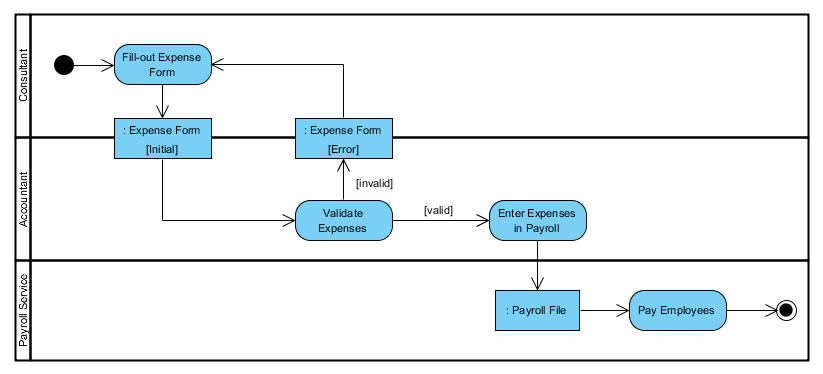
What are Swimlanes?
A swimlane is a way to group activities performed by the same actor on an activity diagram or activity diagram or to group activities in a single thread, swimlanes have to be ordered in a Logical Manner.
Here is an example of a swimlane activity diagram for modeling Staff Expenses Submissions.
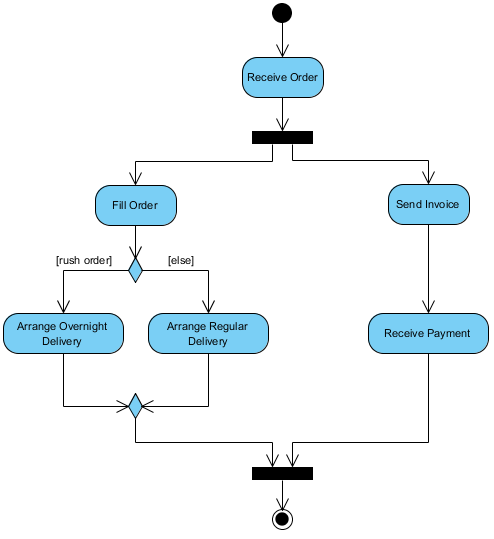
Order Processing Example
A customer wants to order his furniture online, so the company he bought from has then to fulfill it and get paid.
- The company receives the order
- The company sends back an invoice and starts the delivery process
- While the payment is processed the type of order must be received and implemented (rushed or standard delivery)
- Once everything is ready the order is shipped
- The company warns that the shipment is on its way
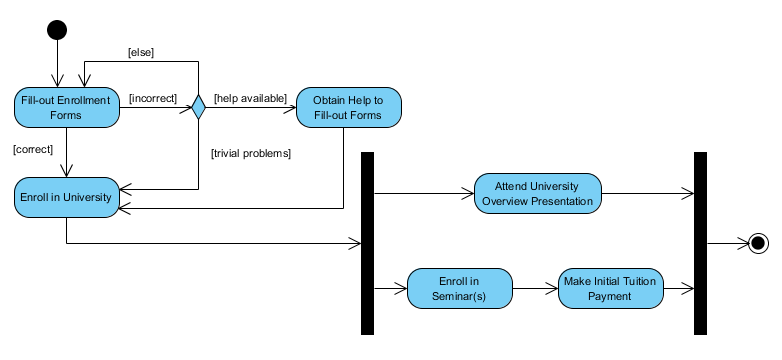
Student Enrollment Example
This UML activity diagram example describes a process for student enrollment in a university as follows.
- An applicant wants to enroll in the university
- The applicant hands a filled out copy of Enrollment Form
- The registrar inspects the forms
- The registrar determines that the forms have been filled out properly, and informs the applicant of the outcome.
- The registrar informs students to attend a university overview presentation
- The registrar helps the student to enroll in seminars
- The registrar asks the student to pay for the initial tuition
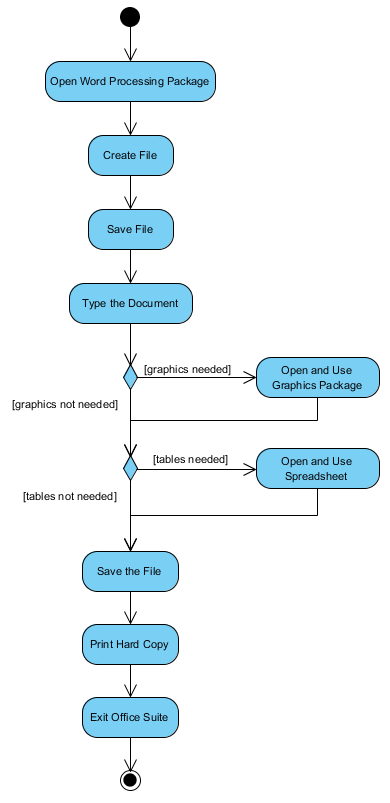
Example of Modelling in a Word Processor
The activity diagram example below describes the workflow of using a word processor while creating a document.
- Open the word processing package
- Create a file
- Save the file under a unique name within its directory
- Type the document
- If graphics are necessary, open the graphics package, create the graphics, and paste the graphics into the document
- If a spreadsheet is necessary, open the spreadsheet package, create the spreadsheet and paste it into the document
- Save the file
- Print a hard copy of the document
- Exit the word processing package